The staff & planning committees of FIRST Indiana Robotics spend a lot of time asking "where" questions: "where are our teams?", "where should we host events?", "where should we focus our team recruiting efforts?", "which teams work within a 50-mile radius of this company that wants to give away a bunch of money?"…
(that last one wasn’t exactly a "where" question, but you get the idea)
Most of those questions were answered by… guessing. Or spreadsheets populated by someone punching addresses into Google Maps & transferring drive times or distances around. And the data collected or generated by those very manual processes was often not shared in a place or format that made it easy to reuse from year to year, or even from conversation to conversation. There’s a lot of inaccuracy, duplicated work, and wasted time in that - so there’s lots of room for improvement!
I built the FIRST Indiana Robotics Atlas to provide a centralized place for all of this location-based data to live, as well as provide an easy interface to answer common geography-themed questions. Built with Sinatra, MongoDB, and MapBox, it stores free-form data about our teams, schools, and event sites acquired through importing spreadsheets, scraping data from websites, or via manual entry. In addition to turning that data into useful information through pre-built reporting tools, I also created an interface for the more advanced users that allows them to build MongoDB aggregation pipelines right in their browser.
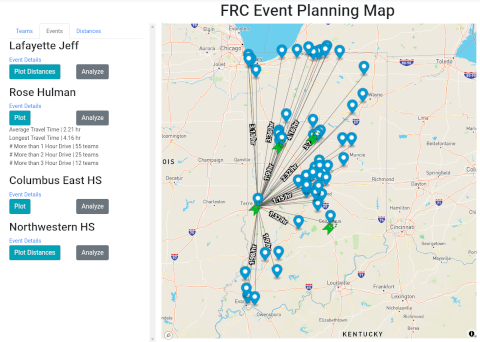
For example, one of the goals of the committee that decides the locations of the FIRST Robotics Competition events is to try and place the events at locations that minimize the amount of time our teams are driving, and ideally to get every team to at least one event, if not two, within a 2-hour drive. To help meet that goal, one of the pre-built reporting tools takes the proposed events sites & the set of active FIRST Robotics Competition teams and calculates how many teams are within a 1-, 2-, or 3-hour drive of each event, as well as the average & longest drive times. The committee can then enter a set of events to get another report of how close that combination comes to meeting their goals.
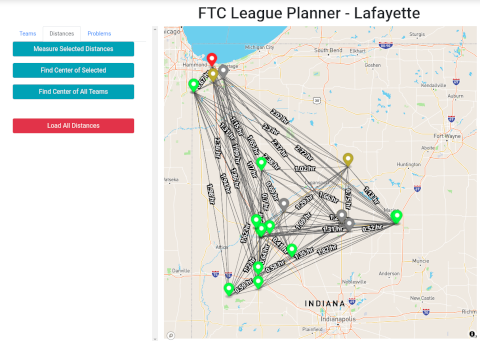
One of the other programs, FIRST Tech Challenge, has a different annual geography-based problem to solve. Their teams get organized into leagues, groups of around a dozen teams that compete at small-scale meets to practice & prepare for the next level of competition. This league assignment process can be kind of tricky, trying to balance the need to keep each league in that sweet spot of 12-16 teams while also keeping the distances that our teams need to drive to a minimum. There are a slew of interconnected pre-built reporting tools within the Atlas to allow the planning committee to experiment with placing teams in different leagues and see how the balance of event population and geographic proximity changes, and then to generate a nice color-coded map when the decisions have all been made.
Speaking as someone who is part of both of these planning committees, these tools will save us hours of work every year as we plan events, and as we start pushing more data into the Atlas, we’ll be able to efficiently come up with answers to a lot of other location-related questions too!